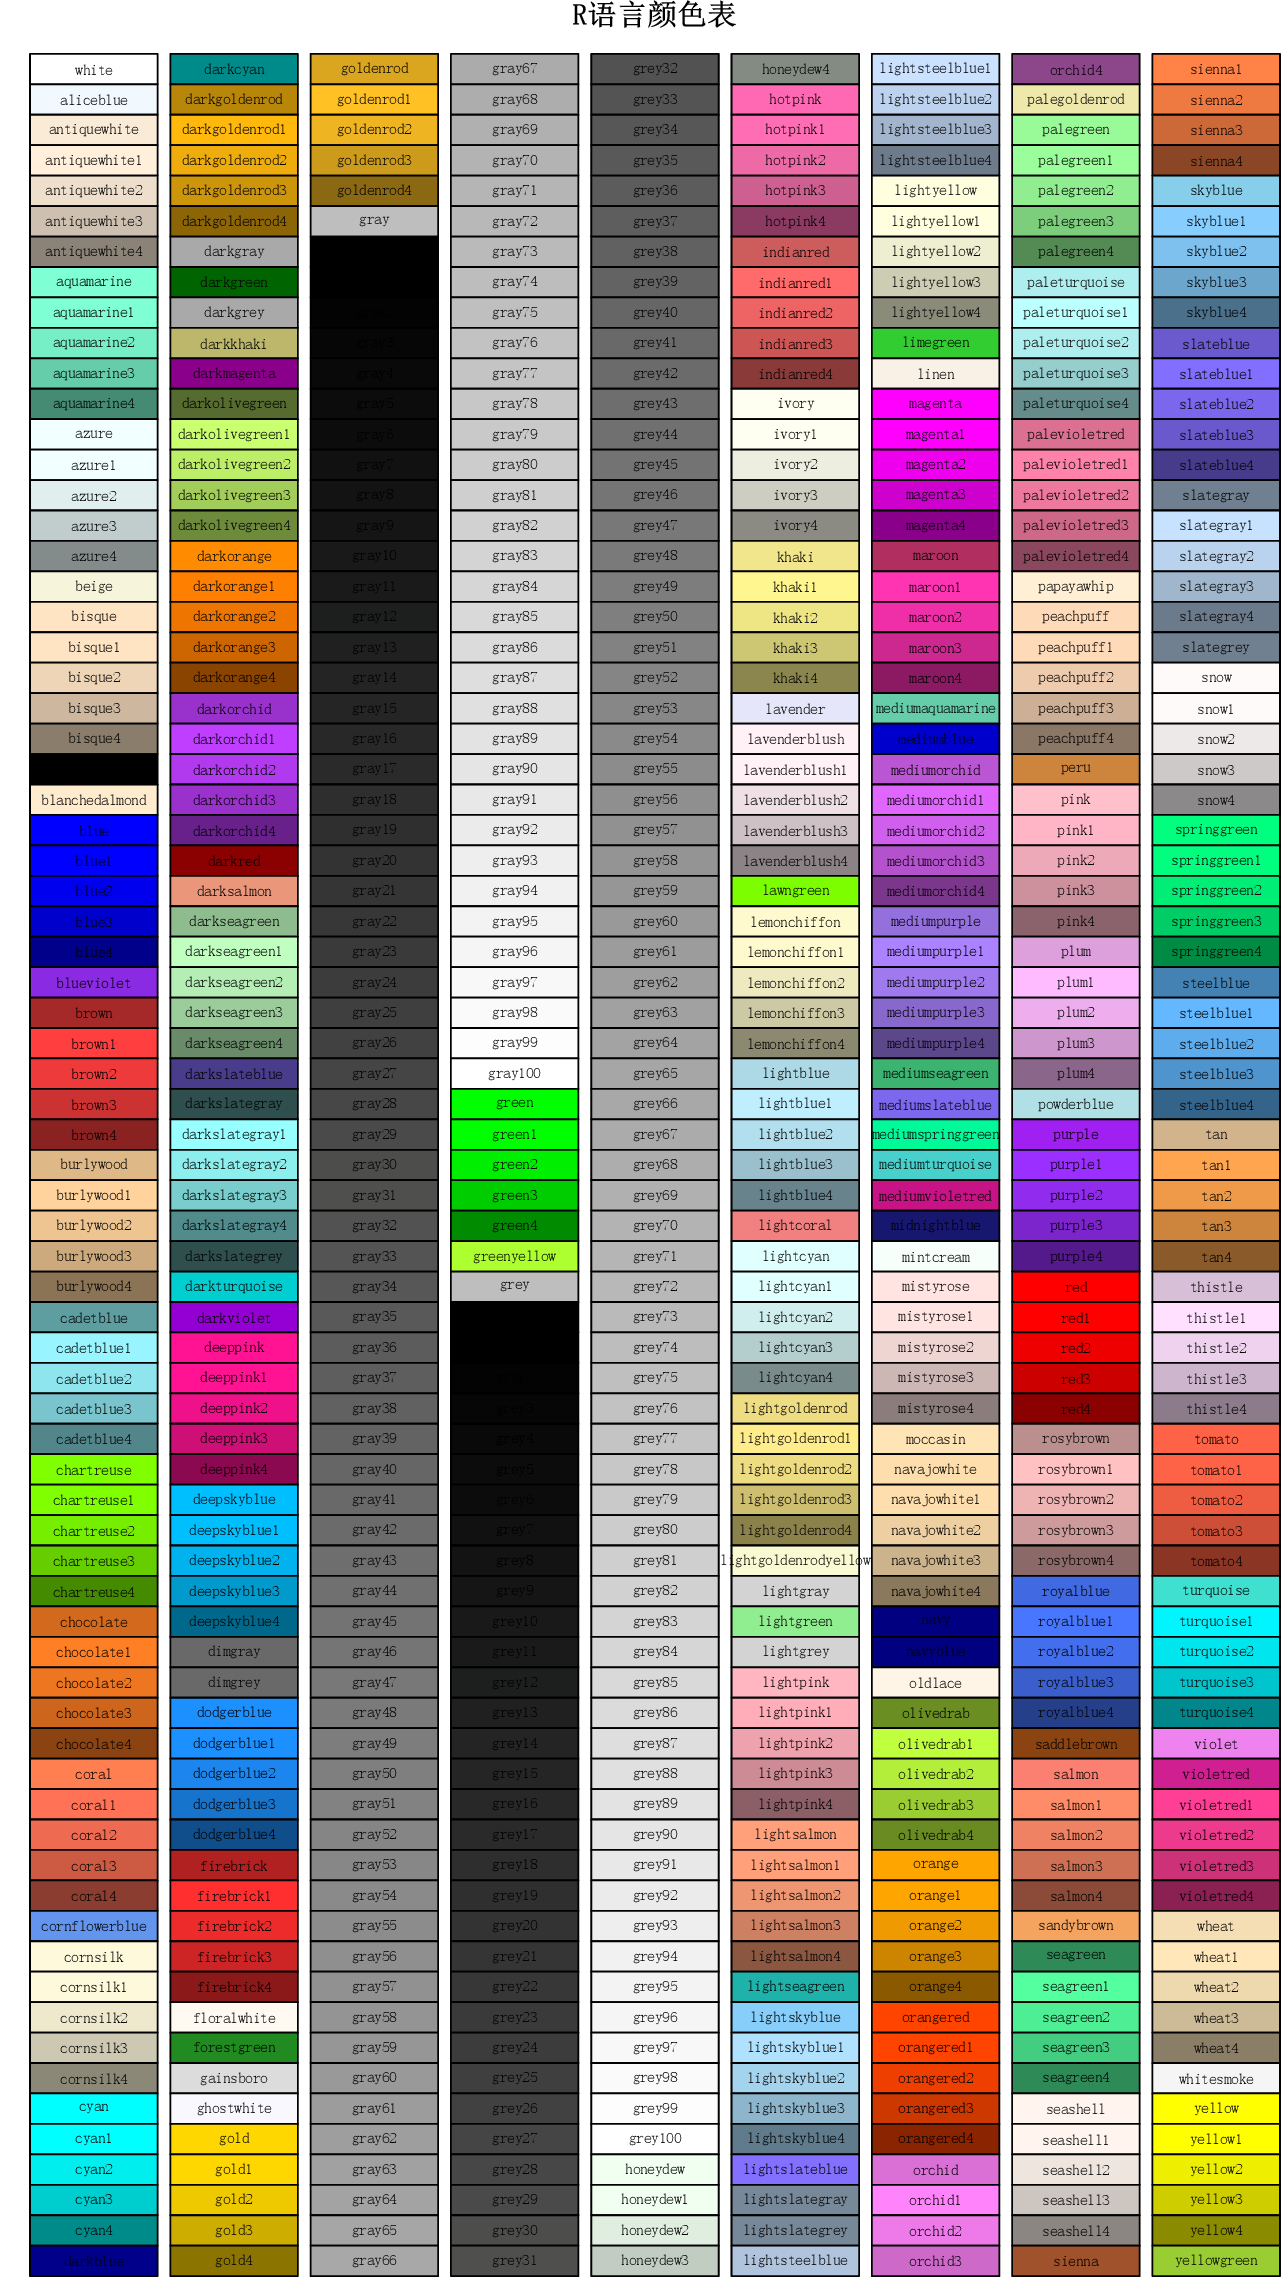
 R语言颜色表
用plot+rect+text绘制R语言颜色表。
# R语言颜色表
PDF版新标签页打开&下载 (opens new window) 
# 绘制代码
cairo_pdf(R语言颜色表.pdf,9,16,family=SimSun)
cl=colors()
par(mar=c(0,0,0,0),bty="n")
plot(c(0, 98), c(0, 73), type = "n", xlab = "", ylab = "")
title(line = -2, main = R语言颜色表)
for(i in 0:8){
    rect(i*11,73:1,i*11+10,72:0,col=cl[1:73+i*73])
    text(i*11+5,73:1-0.5,labels = cl[1:73+i*73],cex = 0.6)
}
dev.off()
1
2
3
4
5
6
7
8
9
10
2
3
4
5
6
7
8
9
10
上次更新: 2024/03/11, 23:50:27